Friday, September 29, 2017

THIS BLOG HAS MOVED TO ...

...the A&O&B website. Link to all our blogs and articles - new and old - here

Link to the A&O&B homepage here

Thanks!


Friday, May 05, 2017

'WILL RADIO BE PUSHED OUT OF THE CONNECTED CAR?" IS THE WRONG QUESTION FOR BROADCASTERS TO ASK

A recent A&O&B Facebook post from Jaye got quite a bit of attention.
It concerned a story by the Las Vegas Review-Journal’s Todd Prince speculating about whether or not television would remove radio from the car in the same way it did in the living room – only this time using tablets.
The article also made some estimates about the growth of the connected car – now reported to be 12% but projected to reach 85% by 2025.
Business Insider’s Andrew Meola foresees that connected cars will cross the 80% threshold by 2021 and that this would equate to a “compound annual growth rate of 35% from 21 million connected cars in 2016.”
“Internet-enabled cars” is a topic we’ve been tracking at A&O&B for a number of years through our annual online perceptual Roadmap.
Our “Roadmap 2017” looked at the percent of 18-54 country listeners who reported having either a built-in or plug-in connection to the Internet.
This year’s 13% “built-in” is similar to the 12% cited in the Las Vegas Review-Journal’s article. The percent of Roadmap 2017 respondents reporting built-in access has more than doubled over the past 2 years while those having plug-in access is up significantly too.
Meanwhile the percent of listeners self-reporting that they do not have in-car Internet access fell below 50% for the first time since we’ve been trending the data.

A project by Accenture showed that among infotainment services, entertainment scored significantly higher than information, productivity and educational in terms of importance. The study also found that among technology choices, streaming music (82% either currently using or wanting to use this technology) had a sizeable lead over operating smart phone via steering wheel controls (70%), web surfing using an in-car monitor (50%), and read and dictate emails while driving (49%).
Last summer Nielsen reported that among all ages surveyed, “safety is consumers’ top tech consideration.” However the interest in connectivity vs. safety was nearly tied – and connectivity was number one in interest among Millennials.
Meanwhile, according to a Business Insider report from 2015, consumers who are aware of connected cars are most interested in streaming music inside the car (69%), surfing using a monitor (57%), one or more of five traffic/driver-related features (41-52%), and access to social media (40%).
Earlier this year Edison Research reported on in-car audio sources via their Infinite Dial. Including in those findings were that, among persons 18+ who’d either driven or ridden in a car in the last month:
·         AM/FM in-car listening from 2014 to 2017 is off 86-82%.
·         Listening to owned digital music increased from 31-45% (with CD usage down 61% to 52%).
·         Online radio listening increased 14% to 26%.
·         Listening to Internet radio in the car using a cell phone connected to the car’s audio system rose from 26 to 40% (based on those who own a cell phone).

According to Radioworld.com, Scott Burnell, Ford Motor Co.’s Global Lead for Business Development and Partner Management, Ford Developer program said that despite an increase in streaming, broadcast radio has unique advantages and opportunities. “Humans want interactions with humans; they want interactions with other humans. They want friends, family and someone they trust to tell them what is good and what they should be checking out.”
Plus, the above referenced BI survey noted that 25% said they would accept commercials as payment for these services being free.
Humans interacting, local insights, and commercials as compensation – sounds like some of the things radio can (should) do best.
So back to the question of, “Will radio be pushed out of the car?”
Tomorrow or the next day? Not likely.
But as Roadmap 2017 pointed out, the percent of Internet-enabled cars – at least for country users – continues to increase. And that’s a trend expected to continue as older cars are replaced with connected ones.

So a more urgent question is, “What will we do today (and tomorrow and the next day) that will place us in the top tier of ‘must hear’ content?”

Wednesday, April 12, 2017

Expecting the Unexpected: Preparing Now to Manage a Future Crisis

The past few weeks have provided strong reminders that PR disasters happen.

Simply opening Facebook these days should provide you sufficient encouragement to have a plan for how you would handle a worst-case scenario.

Radio is far from immune from things suddenly going very wrong: from something that aired that wasn’t supposed to, to a contesting misstep, to the exiting of a popular talent.

A good starting point for reviewing or creating your own PR disaster plan comes from this piece by Steve Gosset that appeared in the Harvard Business School's Harvard Management Communication.
  • Develop a “decisive and sincere” response that shows humility by admitting mistakes and promising to make amends. This can help minimize long term brand damage.
  • Have someone in authority be the face of this honest empathy. Leadership should be perceived as understanding the problem, managing the situation, and doing the right thing. One caveat: be sure the brand spokesperson can believably convey the message. And avoid “No Comment” or being non-responsive. Both can be perceived as guilt.
  • Create a crisis plan and review it annually – even consider a crisis drill.

Jacob Warwick a contributing author to the Percolate Blog and the content manager for Honigman Media suggests learning from other brands’ crisis responses in order to limit brand damage.

Responding quickly is one lesson to embrace.

Citing Yum! Brands’ quick response to a false claim about their beef,
“Taco Bell was quick to respond by revealing the actual ingredients in their recipes and launched a multi-platformed PR campaign that included a public service announcement distributed through their social media outlets such as YouTube, Facebook, and others.”
Warwick pointed to a poll showing that the brand's prompt Facebook efforts were perceived positively by 91% while their YouTube response received an 89% positive response.

He goes on to suggest the following checklist:
  • Understand what happened
  • Establish a simple, consistent, and clear response
  • Create a monitoring system
  • Address small brush fires
  • Have a distribution strategy for apologies
  • Make disasters learning opportunities that can prevent similar situations from occurring in the future

Fast Company’s 5 Steps to Regain Trust After a Disaster offers some additional insights and recommendations:
  • Acknowledge the Issue and setup a task force.
  • Set up a “stop the bleeding team” who will think as the competition thinks (i.e., taking advantage of your situation).
  • Create empathy. Overreact in favor of the consumer
  • Find friends who can help you spread your point of view and talking points.
  • Rebuild your reputation.
"While the short-term machine is in action to manage the outrage, go back to the drawing board and ask yourself what’s needed in order to recover your long-term reputation. Remember you’ve just lost your most essential brand value–trust–so anything and everything you say in the future will be questioned."

Here are some other resources you might find helpful:

And one final thought from Fast Company:
… [a] PR crisis is a wake-up call for every company to prepare in case of a similar blunder. No matter how good you are or how trusted your brand is today, no one’s immune from a PR crisis forever.

Have a crisis-related experience or pre-crisis preparation you'd like to share?

Photo Credit Copyright:

Saturday, April 01, 2017

9 Lessons from Baseball that Can Help Your Radio Station

Baseball likes the number 9:  9 players in the batting order, 9 innings, 9 fielding positions, great players who wore the number 9 like Ted Williams, Roger Marris and Carlos Guillen. 

So in honor of Opening Day 2017, here are 9 ways baseball can inspire you to do your best radio.

And, be warned, we just might go into extra innings.

1. Baseball is played one pitch at a time.

The standings, the win loss record, even the box score are only summations of a game’s pitch by pitch activity.
A pitcher discussing his performance is likely to zero in on a few pitches that made a difference in a game.

Likewise, the impression of a show is earned one break at a time. Think of each break as a pitch that could have a game changing impact.

2. Staying stationary invites others to pass you.

A core principle behind the “Moneyball” strategy is that new thinking can give you a competitive advantage. In the case of Billy Beane and the Oakland A’s it was the suggestion to use was non-traditional metrics to determine the value of a player – perhaps most famously at the time (late 90’s to early 2000’s) a player’s on-base percentage was undervalued while slugging was over-valued.

Stations too can have assets that could be leveraged for greater benefit: someone with raw talent that can be groomed for greatness, someone with untapped creative skills that perhaps is in another department, even non-radio people in the market who could make a positive contribution.

Similarly consider those metrics you already have access too; time spent with those (ratings, research, logs, your music system, etc.) can open new doors of opportunity.

We have so many demands on us that creative thinking and potentially great ideas that have yet to be explored can be casualties of time, resulting in a ‘status quo’ approach that can allow others to capture a competitive advantage that could have been yours.


3. “You don’t save a pitcher for tomorrow. Tomorrow it may rain.” Leo Durocher

In her piece, “Don’t Save the Best for Last,” Psychology Today writer Amy Cooper Rodriguez shares the story of her grandfather who would always squirrel away things until they fall apart instead of using them when they were most valuable. Vegetables that have gone bad would be eaten before the fresh vegetables - which in turn would go bad before finally being eaten.

What’s holding you back from launching your latest great idea, a great coaching tip someone gave you, or working on an area of your performance that you know you want to improve? Fear of failure? Lack of confidence? Simply not giving it a high enough priority? Meaning to get started but never quite getting around to it?

Tony Robbins: “…the greatest gift that extraordinarily successful people have over the average person is their ability to get themselves to take action."


4. Relatedly, the home run is not the only measure of hitting success

Great baseball thinker Paul Johnson puts the value of a home run at three times that of a single. However the ability to home runs is still no guarantee of winning. In fact, a double, a single and a walk have a greater combined value than a homer.

The 2016 Baltimore Orioles had the highest ratio of home runs to at bats - about 1:22. Meanwhile the 2016 World Series Champions the Chicago Cubs were 13th.

The point is, knock your content out of the park when you can, but remember that being able to get on base consistently wins games too.


5. Scouting is Important

Injuries, lapses in performance, schedule changes, are all part of baseball making a team’s farm system an important component of remaining competitive. Staff changes happen for any number of reasons.

Having good people on your radar is smart not because doing so makes it easier to fill vacancies, but rather because it's a strategy that can help maintain or improve your lineup.

No ball team would figure they could replace their all-stars with sub- par players they had to ‘settle for’ and continue to perform at the same level.

A radio station can’t think that way either.


6. “If you don't know where you're going you're gonna wind up some place else.” Yogi Berra

Successful stations (and people for that matter) need a plan - probably lots of them. In radio the list includes ratings and sales plans to get to reach goals, plans for differentiation, a plan for social media, a plan to help your talent improve, and a backup plan or two for should original plans go sideways.


7. “The manager’s job is to do everything it takes to set his or her team up to win.” Earl Weaver
Know each individual on your team: their skills, motivations, values and vulnerabilities. 

Make everyone feel important and valued.

Recognize those with the greatest potential and spend sufficient quality coaching time with them.

Have a well-thought out strategy that takes advantage of your assets.

Solicit input from others.

Writing in Forbes, Glenn Llopis put it this way: “…managers must quickly earn trust from their colleagues to inspire team unity and collaboration that is centered on the fundamental principles of loyalty, communication and transparency. The best managers get it: no explanation required. They are proactive in addressing the needs of their team. They go out of their way to be creative and find new ways to uniquely motivate each member of the team. 

They are always aware of moods, mindset, attitude, and engagement levels. The best managers are the ones who “take one for the team” and can quickly turn around times of duress into rewarding opportunities.


8. Embrace the Bobble Head!

While it varies across ball clubs, playing better generally improves attendance. Still, an effective promotion can goose a single night’s attendance. Bobble Head Night for example has spiked attendance 5000 to 20000. Smaller promotions have helped generate additional if smaller ticket sale increases.

Bobble Heads are prized by fans as limits edition, one of a kind collectible. Fox Sports reports that some are even passed down as family heirlooms.

The key to any successful baseball promotion is the same as it is for radio: know what listeners will respond to and why.

Radio is in a unique position to create once in a lifetime experiences for listeners. Embrace it.


9. Respect the fans

Fans love their team and expect (rightly so) to have the team reciprocate. Such reciprocity starts with a goal of fielding the best team possible and extends to creating a culture where everyone on the team is prepared to contribute and to play "all out" every day on every play – which is a basic fan expectation.

It also means creating a great environment to watch the game in person, the ability to access the game anywhere on any device, to have more than an impersonal relationship with the team.

Country fans have similar expectations. Whether it’s the result of the bond artists have formed with country fans or the personal nature of the music or the efforts of country stations to connect fans to artists, there’s a connectivity expectation.

It’s magic.

Have a mindset of “loving on the fans” and making them feel special


Extra Innings:

10. “If you’ve got a great fastball, throw it.” Mike O’Malley, Consultant/Partner A&O&B

Translation: find out what you’re best at, and do that as often as you can.

I'm always disappointed when I ask an air talent (often new to the business), what it is they do best on the air and get a blank look as an answer. How will you grow your assets if you don't know what they
are?

Sure, you’ll need some additional, solid material to round out your performance, you’ll be remembered by what you do most often – so be sure you’re always playing to your strengths.

It’s opening day every day at our stations – a new day of fun, ideas, creativity, and a chance to connect in a special way with those who have come through our ‘turnstiles.’

Who’s ready to take the field and be awesome?!

Monday, March 20, 2017

Some Satisfying News: Country Radio Satisfaction Levels Tick Up

First, “Thank you!” to all who were a part of A&O&B’s 23rd annual Pre-CRS Seminar Wednesday, February 22nd, in Nashville. From our attendees to our presenters to our sponsor BMLG – we appreciate each of you!

As we’ve done for the past 12 years, we presented some top-line data from our just-out-of-the-field online perceptual study: Roadmap 2017. 

This year’s wonderfully rich report included 11,742 Country Radio Listeners across the US and Canada with 9,138 aged 18-54 - 89% of whom were Country P1s.

For those of you who were unable to join is in person in Nashville, we’re excited about sharing some of the information we presented. We’ll be doing this in installments over the coming weeks.

And for those of you who were able to join us in person, this series will give you an opportunity to revisit some key information designed to help all of us create the best radio we can for our listeners and clients.

Enjoy our first installment: Country Station Satisfaction.  And as always, your feedback and thoughts are most welcome.


Country Station Satisfaction:

Here’s some good news. Country Station Satisfaction is up a tick.

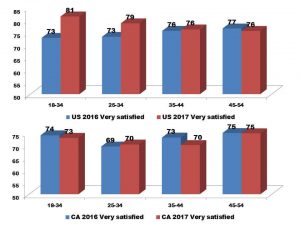
Among our full panel of nearly 12,000 Roadmap 2017 participants, 75% reported being “very satisfied” with their country station. That’s up fractionally from last year’s 74%.

Among 18-54s, 77% of US respondents and 72% of Canadian respondents reported being “very satisfied” with their country stations. This is a slight increase for US stations though a slight decrease for Canadian stations.

We isolated station satisfaction by demo to see if there was difference across demo or change across demo compared to last year.  While Canadian respondents’ opinions varied little from 2016, 18-34 US panelists showed a notable increase in satisfaction.


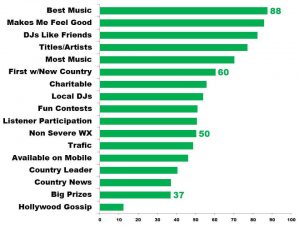
We pursued the satisfaction by asking respondents what station elements/attributes were important to them in choosing one country station over another.

“Plays the best music for my tastes” was number one in importance and across all four demos while “Makes me feel good when I listen” was second.

Here are the 17 attributes we investigated and how each ranked:


There were some interesting differences across demos.

For example, 18-24s ranked Title and Artist Identification higher than 25-54s though this demo placed identifying titles and artists fourth.

Music Quantity was fifth for all cells though in terms of percentages it was of greater importance to 18-34s.

We also asked panelists how their local stations did in satisfying their listeners in these areas. Overall, stations over-performed in “Makes me feel good when I listen” and “DJs that sound like my friends” (indexing at 101 and 106 respectively).

In aggregate stations indexed close to 100 for both music quality and quantity.

Among all 18-54s, most stations over-indexed on the other 8 offered attributes.

We probed the 6% who expressed some level of dissatisfaction (“somewhat dissatisfied” or “very dissatisfied”), why they felt this way. The top three issues for these listeners were, “repeating songs far too frequently,” “too many commercials” and “don’t like the music mix.”

Compared to last year, complaints about song repetition were down in the US (59-54%) and flat in Canada (62-63%).  Having issues with the music mix were down in both the US (29-25%) and Canada (30-26) compared to last year. Complaints about commercial load were flat in the US and down in Canada.

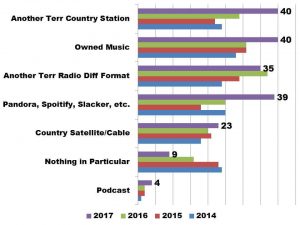
We then asked when dissatisfaction resulted in switching off the station for something else, what (if any) other destination did they most frequently go.

Here’s the four year trend (shown in percentages):


Among the most notable trend is that “Nothing in particular” as a destination continues to fall – now just 9% from close to 25% four years ago suggesting that listeners have increasingly found particular alternatives.

The destinations with the largest growth are services like Pandora and Spotify, owned music, and another AM/FM Country station. As a specific destination, only another AM/FM radio station with a different format declined from last year although that decline was small.

There were differences across demographics. In the US, the top switch-to destination for 18-34s was a service like Pandora or Spotify. 35-44s were equally likely to go there as they were to another AM/FM Country station.  Meanwhile for 45-54s another AM/FM Country station was the top destination.

For Canadians, the top 18-34 choice was a streaming service which tied with owned music. Among 35-54s the top destination was another AM/FM Country station or a satellite or cable option with 45-54s also choosing to listen to music they own.

With overall station satisfaction up, asking how music is faring with listeners compared to last year is a logical next question. For both the US and Canada, 2017 saw a change in what had been a several consecutive years of declining “country is the same or better than last year” scores.

And those scores as well as era preferences, music discovery and more are what we’ll dive into in a future post as we go under the hood on Roadmap 2017.
In the meantime, feel free to share your thoughts with us and fellow readers – they’re always valued.


Clients Only: Access the full Roadmap data here.

Wednesday, January 25, 2017

Roadmap 2017: Six (of the many) Trends We're Watching for Country Radio

As we prepare to send A&O&B's on-line perceptual “Roadmap 2017” into the field, I thought a look back at some of the many topics we explored in last year’s study would be interesting to share again with the idea of doing a follow-up post to see how these same topics look when we complete this year’s survey.

As background, nearly 10,000 Country Listeners across the US and Canada participated in last year’s project which ran for three weeks in January and February. From that data, I did a quick pull of 18-49 US and Canadian respondents’ feedback on “In-Car Connectivity,” “Switching Behavior,” Station Satisfaction” (different from Music Satisfaction), “Listener Hot Buttons,” “Social Behavior,“ and “Loyalty.”

Here is what the data revealed.
  1. In-car connectivity increased significantly from 2015. While all demos saw an increase compared to last year, 18-34’s were the most likely to be connected compared to 35-54’s. Plus, the percent of connected 18-34s grew at a greater level than that of 35-54s.
  2. Country switching behavior was more decisive – at least in terms of what format listeners switched to when leaving their favorite country station. “Nothing in particular” fell by roughly 30% while the greatest increase was “Switching to another AM/FM radio station with a different format.” The percent switching to a Podcast doubled though that choice was far behind others including “Nothing in particular.”
  3. While overall station satisfaction levels remained high, there was a slight decline again this year the top tier – the “Very Satisfied” response group. The greatest dip was among 18-24s.
  4. “Playing the best music” continues to be the number one “hot button” for listeners followed by “makes me feel good when I listen,” “DJs who sound like my friends,” and song quantity. Last year song/artist identification broke into the Top 5.
  5. The social media platform with the largest increase of daily usage year over year was Instagram.
  6. The P1 "Switichability Resistance" remained strong - near 50% - thus maintaining a high bar for format challengers.
Each of these six pull-outs presents some important thinking points for 2017:
  • How are we leveraging the unique assets we own?
  • What are any listener-perceived vulnerabilities or opportunities?
  • What will our strategy be in a time of lower “switch to” cume?
  • Knowing what listeners’ hot buttons are, how are we satisfying those wants and needs?
  • How are we managing our social media strategies and efforts?

Roadmap 2017 will go into the field this week and provide us with fresh, new listener feedback to consider.  Participating stations will receive not only the national data, but also separate feedback from their own listeners in a special, local, custom breakout. This year, we’ve added even more questions that offer head-to-head local comparisons of the perceptions OUR listeners hold vs. those of our direct format competitors.

We’ll present top line national findings for both the US and Canada surveys at A&O&B’s 23rd annual pre-CRS Seminar in Nashville, Wednesday, February 22nd at 10am.

We hope you can make it.

You can RSVP to the A&O&B session here.

You can register for CRS 2017 here.

Inquire about Roadmap participation here.

Friday, January 13, 2017

Formats with the Most Momentum Entering 2017: Questions to Ask As You Survey the Competitive Landscape

Towards the end of each year, Nielsen releases its Top Audio Trends report which lists the 10 leading formats in terms of share for the past January through November in PPM markets.  There are separate rankings for 6+, 18-34 and 25-54.

In 2016 News-Talk led in 6+ with CHR winning 18-34 and 25-54. Country and CHR were the only formats to rank in the top three in each demo.

Here are last year’s top three formats.

6+18-3425-54
News/TalkCHRCHR
CHRCountryCountry
ACHot ACAC

Breaking out the formats by demo, it’s tempting to cite the election as driving News/Talk’s position. However, while this year’s 6+ shares were notably higher, the format has been the top 6+ format in each of the last four years.

Of all formats that have been in the top 10 over this time, the format with the greatest 6+ growth since 2013 is Hot AC (+0.9) with Classic Rock a close second (+0.8) and Sports (+0.4).

6+2013201420152016
N/T9.38.88.99.6
CHR8.28.38.28.1
AC7.77.17.47.5
Country7.88.27.97.4
Hot AC5.56.26.76.4
Classic Hits5.35.25.35.3
Classic Rock4.34.75.25.1
Urban AC5.04.94.94.8
Sports4.34.44.74.7
Urban Contemp3.53.7
Mex Regional3.93.73.7

Among 18-34s, Urban Contemporary saw the largest growth since 2013 (+1.3) and has added shares each year. Hot AC also had strong growth 18-34 (+1.2) followed by Classic Rock (+0.9).

18-342013201420152016
CHR12.412.312.412.2
Country9.19.89.18.6
Hot AC6.17.17.67.3
Urban Contemp5.35.86.56.6
AC6.35.96.46.5
Rhythmic CHR7.36.75.85.1
Alt5555
Mex Regional5.65.24.65
Classic Rock3.63.94.54.5
NT3.73.53.64.1

Among 25-54s, Hot AC is the growth leader (+0.9) with Classic Rock next (0.7) and Sports third (+0.4).

25-542013201420152016
CHR8.7998.8
Country7.587.87.3
AC7.56.97.27.1
Hot AC6.16.87.27.0
NT6.86.26.26.9
Classic Rock4.75.35.75.4
Sports4.955.25.3
Classic Hits4.64.54.54.7
Urban AC6.14.84.84.6
Mex Regional4.74.64.14.5

Over the four year period, Hot AC and Classic Rock were the two formats registering the largest gains in all demos.

Across the same time period, Country was off half a share or less in each demo (-0.4, -0.5 and -0.2). However the declines since the format’s highs in 2014 are steeper: -0.8, -0.8 and -0.7.

Shares differ in the diary universe. This trended 12+ format information is available only to diary subscribers via Nielsen’s Audio Today Appendix.

Regardless of the methodology, these questions are worth considering as we start a New Year:
  1. What are the major trends in my market (station trends, demo shifts, market AQH, etc.)?
  2. What are key factors driving these trends for my format as well as my competitors’?
  3. What should my station’s responses be to each of these factors?

As we start the New Year, a quick look back can be a useful tool in moving forward.